Ankerui Electric Co., Ltd., Shanghai Jiading
Abstract : The intelligent, refined and unattended user-side distribution system is an inevitable trend of current distribution management. Design and install smart meters for the distribution circuit on the user side, monitor the working status of each energy circuit in real time; record the power parameters of each circuit. By setting up the system background, real-time monitoring of energy and power parameters is realized, the safety and reliability of the power distribution system are improved, the maintenance efficiency of the management personnel is improved, the labor cost of maintenance is reduced, and the unattended monitoring of the power distribution system is realized. Through the use of real-time monitoring, data collection and storage, the user's power usage level and the operating state of the power distribution system are clarified, providing users with data maintenance for power maintenance costs and property management, and later based on the power distribution system. Analysis of operational data to develop a corresponding distribution system maintenance program. The ACREL-2000 power monitoring system used in the second phase of Sinotrans Shanghai Cold Chain Logistics Center is a brief introduction to the intelligent use of the user side.
Keywords : Sinotrans Shanghai Cold Chain Logistics Center Phase II Smart Building Intelligent Power Distribution System
0 Preface
The intelligent and scientific management of the user-side power distribution system has become the mainstream demand of the current power distribution system. The intelligent power distribution system designed for the user-side power distribution system is already an essential system for current owners and power hosting companies. By constructing a power distribution system, combing the user-side power distribution architecture, installing smart meters at key nodes, setting up a power supply and distribution monitoring system, and completing intelligent management of the user's power distribution system.
 The ACREL-2000 power monitoring system is a user-side power monitoring system developed for the above trends. The system measures the inbound and outbound loops of the second phase substation of Sinotrans Shanghai Cold Chain Logistics Center. Through the real-time measurement, storage and analysis of the energy used by the monitoring loop, the operating status of the entire power distribution system is displayed in the form of a table or a graph. For the intelligent management of managers, provide data basis.
This paper takes the second phase project of Sinotrans Shanghai Cold Chain Logistics Center as an example to briefly introduce the application of ACREL-2000 power monitoring system in this project.
1 project introduction
The second phase of Sinotrans Shanghai Cold Chain Logistics Center is developed and constructed by Sinotrans Shanghai Cold Chain Logistics Co., Ltd. It is an important starting point for the company to build a logistics real estate network, and is a strong guarantee for the cold chain transportation company to expand its market share in Shanghai. The total construction area of ​​the project is about 48,000 m2, and a new six-story complex building and a second-floor cold storage second-floor normal temperature warehouse are built.
A set of power monitoring system is designed for the multi-function instrument of the substation in the project. The power monitoring system collects the data of various smart devices on the site, displays and stores them in the background, and displays and exports them through corresponding reports.
2 user needs
This project is mainly the collection, storage, statistics and display of energy consumption data of the substation in and out of the line. After the basic needs are analyzed and analyzed, they are divided into the following aspects:
1. The system has the function of displaying the operating state of the distribution circuit of the substation in one graph, displaying the bus voltage of the important incoming and outgoing circuit, incoming line, active reactive power, power factor and frequency, and electric energy;
2. The system has a summary of the real-time meter reading statistics of each loop, and the user can freely query the power consumption of each loop;
3. The system has a design loop load trend curve for each monitoring point on the site, which is convenient for maintenance personnel to grasp the ratio of power demand to power supply load;
4. The system can compare and analyze historical data, which can detect potential faults in time and reduce equipment maintenance costs;
5. The system has a communication status display, which can display the communication status of each device in real time, and can monitor the network communication status online;
6, the system has a rights management function, through the user rights management can prevent unauthorized operations;
7. Reserve open data interface to data third party for data upload.
3 design
3.1 Reference Standard
The system is designed to meet the manufacturing and testing standards listed below:
JGJ/T16-2016 "Electrical Design Code for Civil Buildings"
GB/J63-90 "Design Specification for Electrical Measuring Instruments for Electrical Installations"
GB/T13730 "General Conditions for Data Acquisition and Monitoring System of Regional Power Grid"
GB2887 "Technical Requirements for Computing Station Sites"
GB/50198-94 "Technical Specifications for Monitoring System Engineering"
DL/T 698.31-2010 Part 3.1: Technical Specifications for Power Information Collection Terminals - General Requirements
DL/T 698.35-2010 Part 3-5: Technical specification for power information collection terminal - Particular requirements for low-voltage centralized meter reading terminal
DL/T 698.41-2010 Part 4-1: Communication Protocol - Communication between the primary station and the energy information collection terminal
DL/T 698.42-2010 Part 4-2: Communication Protocols - Concentrator Downlink Communication Protocol
DL/T/814-2013 "Functional Automation System Functional Specification"
3.2 System Architecture Design
In view of the scale and nature of the second phase project of Sinotrans Shanghai Cold Chain Logistics Center and the nature of the subsequent development of the follow-up project, the system department of Ankerui Electric Co., Ltd. based on the needs of users and the experience in the same nature of engineering, The construction of the intelligent power distribution system of the building is designed as follows: All the monitoring points of the second phase of Sinotrans Shanghai Cold Chain Logistics Center are now equipped with intelligent power meters, and all adopt the standard Modbus-RTU protocol. The smart instruments installed on the site are connected by hand through the shielded twisted pair cable. The data bus is directly laid to the protocol conversion isolator configured in the background of the system. The protocol conversion isolator directly transmits data through the serial port of the host. The system topology is as follows:
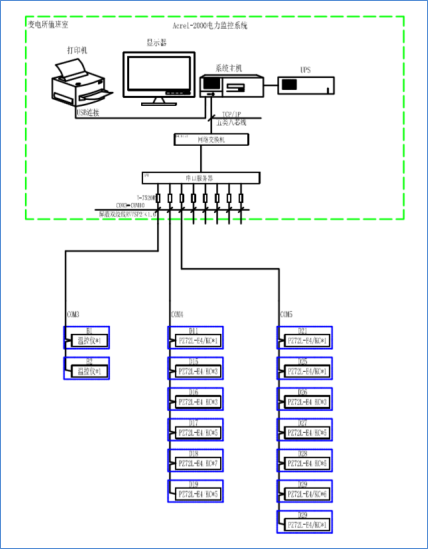
Power monitoring system topology
4 system function
The PC software adopts ACREL-2000 power monitoring system, and completes the functions of software monitoring and power monitoring in the host computer through software configuration, database variable configuration and interface design.
4.1 Features
ACREL-2000 power monitoring system adopts full Chinese interface, which is easy to operate and stable and reliable. Click the corresponding shortcut button to enter the corresponding system function module; the system has a system diagram display, simulation diagram display and network structure diagram display; the system has a friendly man-machine interface, and the display data is intuitive and convenient for users to consult.
4.2 Software features:
4.2.1 Operating system
The software interface can be designed according to the characteristics of the project and the requirements of the customer. The initial interface is the “login interfaceâ€. The customer needs to enter the corresponding password through the user name to enter the system. The interface is shown in Figure 1.

Figure 1 login interface
4.2.2 Communication diagram
The communication diagram is a topology diagram showing whether the communication between the system and the instrument is normal. The change of the color of the interface module reflects the running status of each monitoring point of the entire system. The interface is shown in Figure 2.
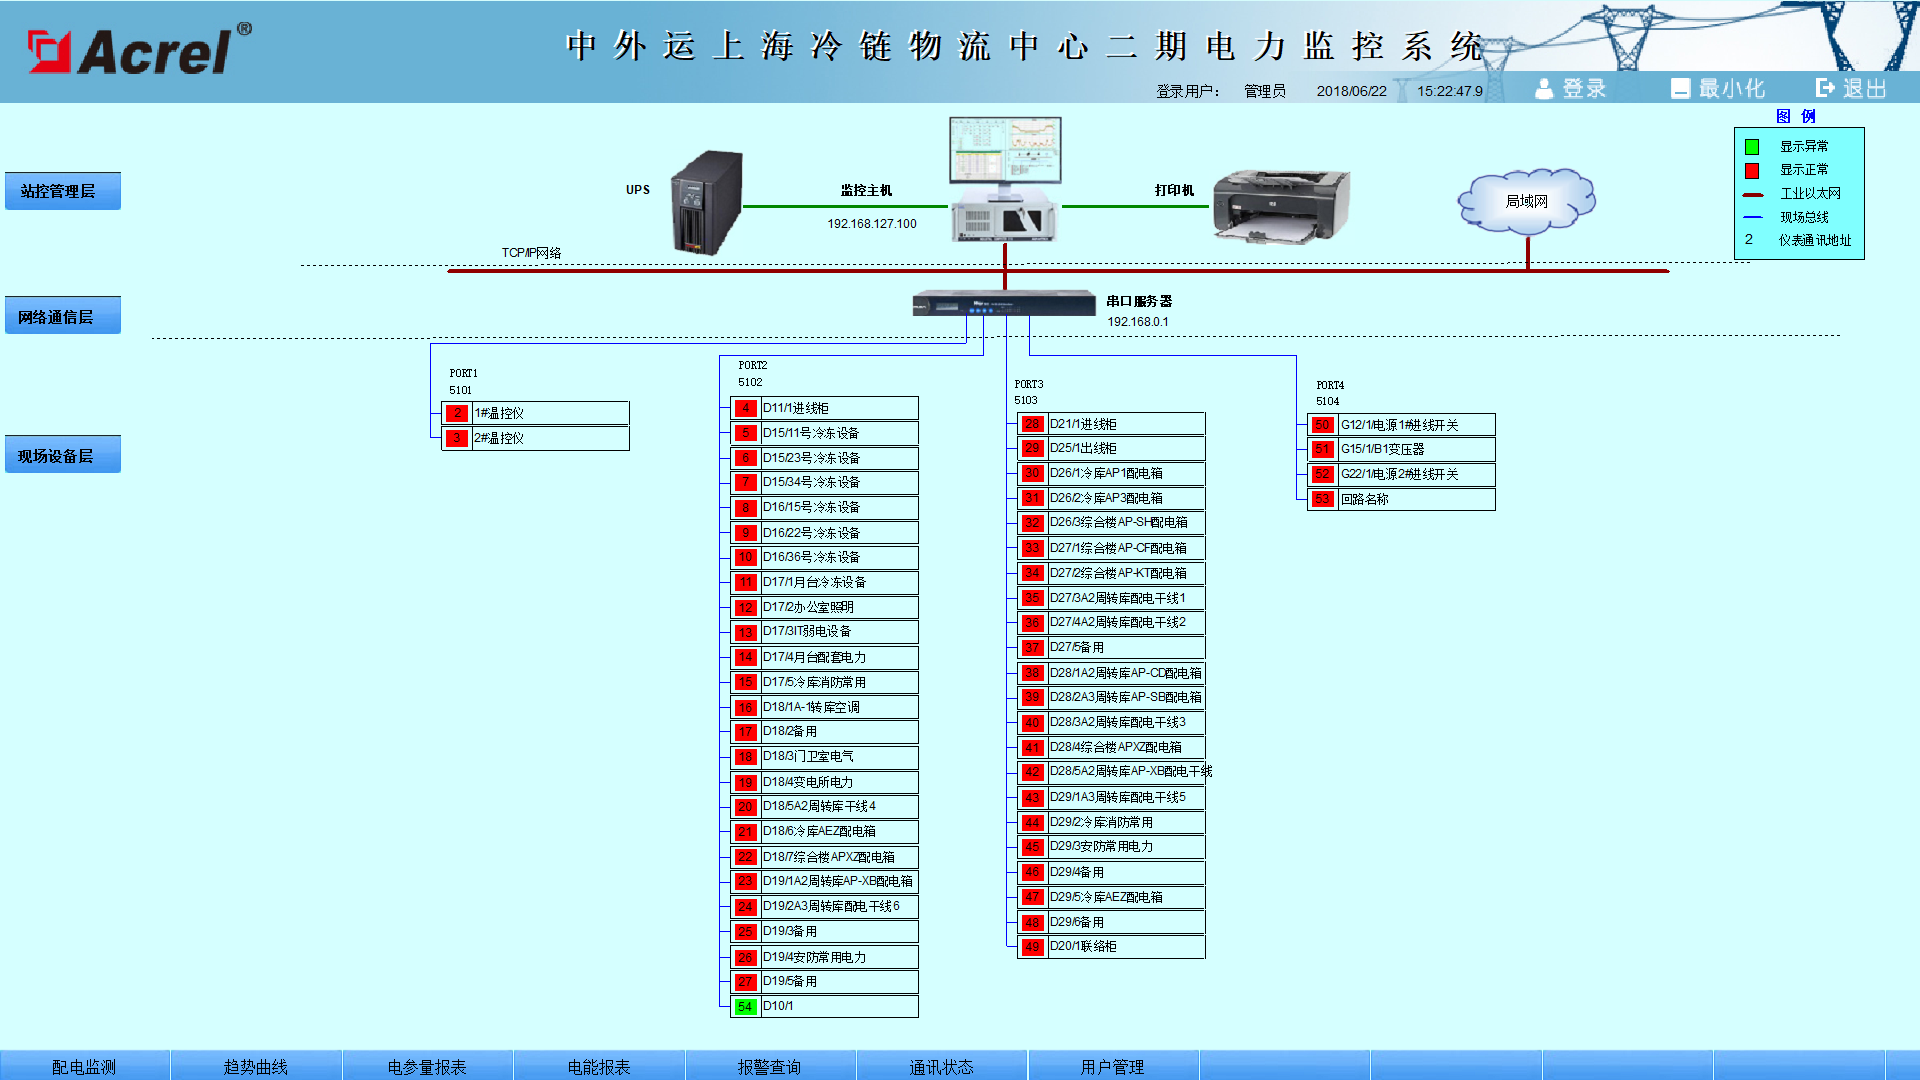
Figure 2 Communication
4.2.3 Monitoring details
The monitoring details reflect the name of the entire system distribution circuit, the corresponding distribution system, and the main electrical parameters of the circuit. Through the display of real-time data, the operation data of each monitoring loop of the project is visually reflected, which is convenient for the manager to know the running status of the system in real time. The interface is shown in Figure 3.

Figure 3 monitoring details
4.2.4 Parameter meter reading
The parameter report reflects the operational data of the monitoring loop of the project at a certain point in time, and the real-time parametric data at a current or past time point reflects the loop status. The main data includes: three-phase voltage, three-phase current, electric energy, active power, reactive power, power compensation factor, frequency. The interface is shown in Figure 4.

Figure 4 Parameter reading
4.2.5 Energy Report
The energy report is the management of the power consumption in the form of a report. The report can realize the functions of monthly meter reading, daily meter reading, hour meter reading, etc., and can be exported or printed in Excel at any time during the system operation. The interface is shown in Figure 5.
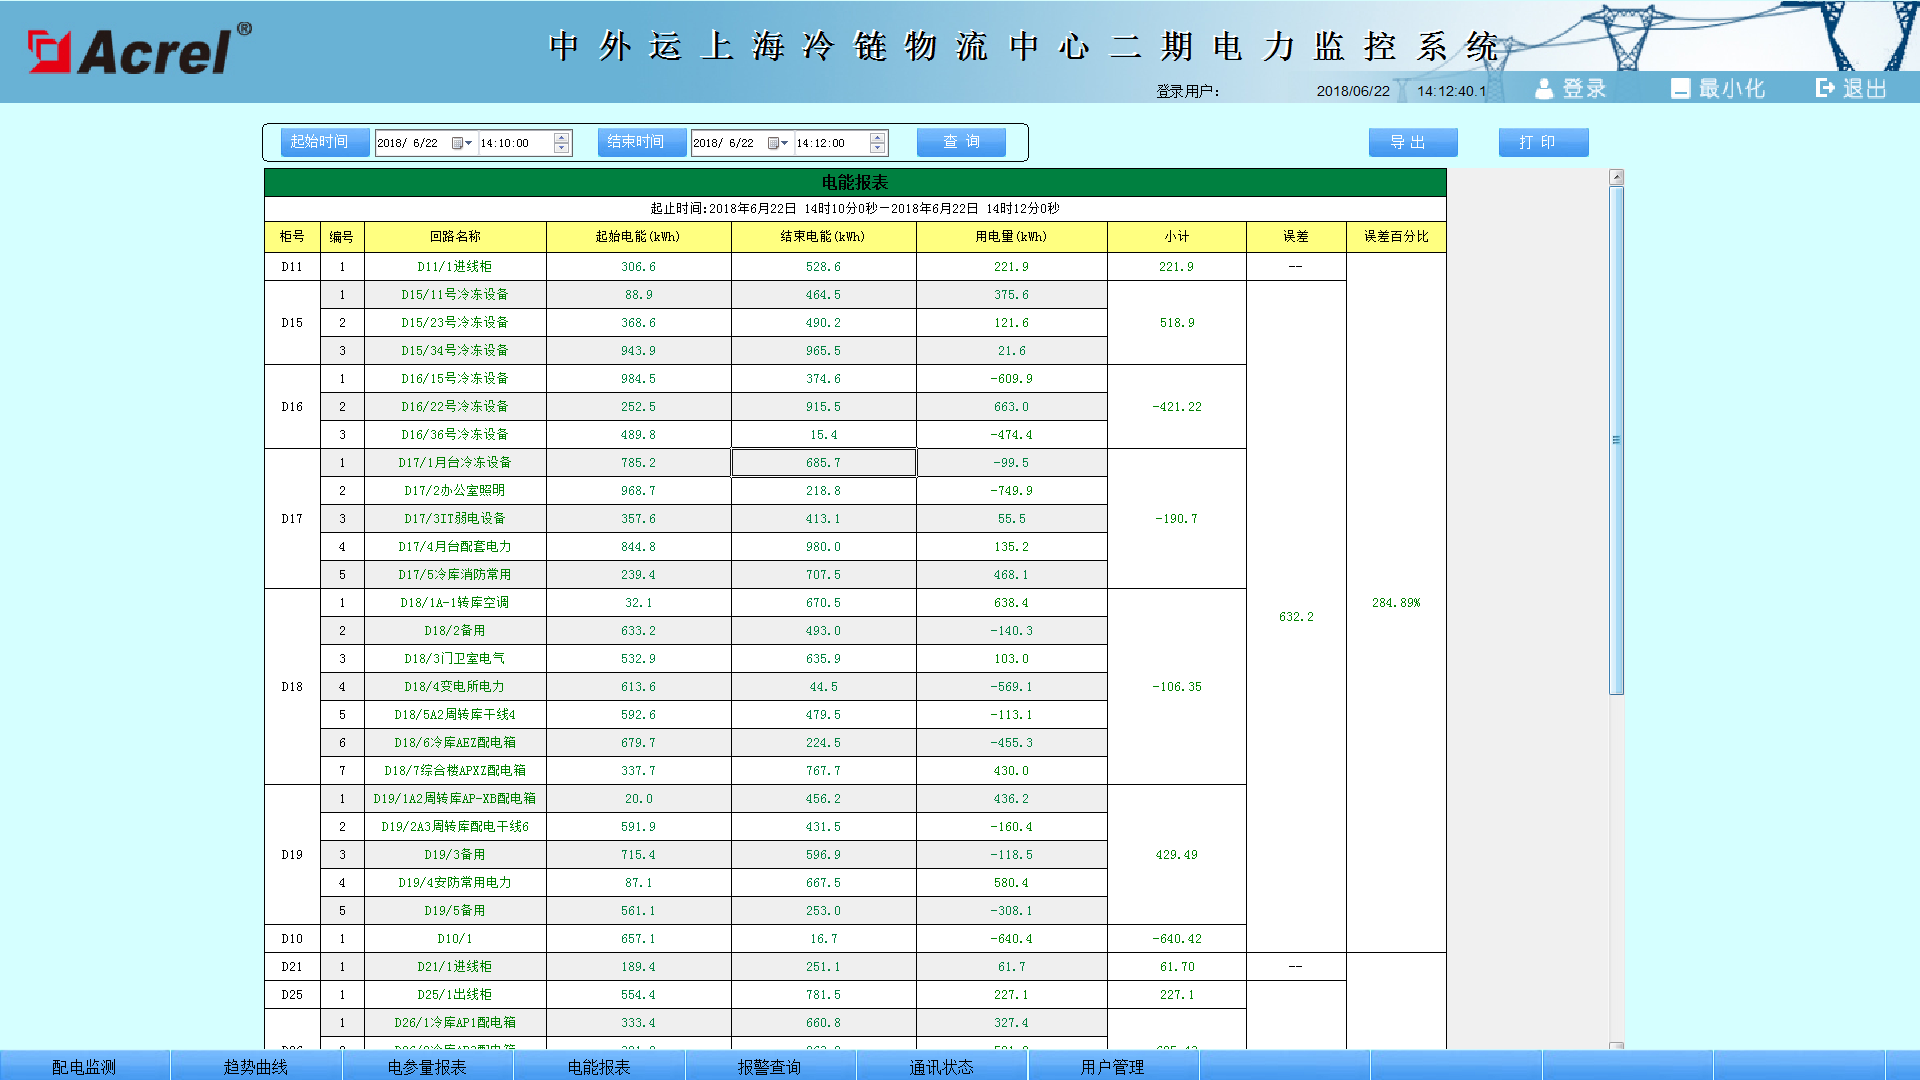
Figure 5 Energy Report
5 Conclusion
The second phase power monitoring system of Sinotrans Shanghai Cold Chain Logistics Center realizes real-time collection, storage, display and export of power consumption data. From the construction of the power distribution system to the later commissioning, the system data is checked, and we provide the corresponding stage in the whole process. At the same time of design, installation and commissioning, the system is also a detailed combing of the building's power distribution architecture. Through the careful classification of the energy consumption, the operation mode and state of the power distribution system in the building are clarified.
In the actual implementation process of this project, we have also arranged technical personnel to provide construction guidance for many times, to ensure the quality of the communication cables of the project, to avoid many common mistakes in construction, and to improve the quality of the project. In this project, the monitoring interface of third-party equipment such as temperature controller and comprehensive insurance is also customized for customers. It meets the customer-related customization requirements, provides customers with a variety of data analysis and processing methods, and export methods to facilitate the related management of the later properties and improve the efficiency of customer service.
In commercial construction projects, owners have relatively high requirements for data stability and timeliness. For the commercial building project, it is recommended to configure the Encore brand PZ series embedded instrument, and the uniformity of the site and the background will improve the stability of the system to some extent. There are great advantages in system architecture construction and post-system hardware and software services. In addition, the system realizes the analysis and processing of the collected data, displays the power usage status of the power distribution loops of the owner in real time, and has a pop-up alarm dialog box and an alarm sound prompt, and generates various energy reports, analysis curves, and graphics. Etc., it is convenient for remote meter reading of electric energy and analysis, research and development of corresponding energy service plan. The system is safe, reliable and stable, and realizes the real-time monitoring of the working status of each distribution circuit and the real-time display of important electrical parameters for the end users of the distribution system, which provides a real and reliable data basis for the maintenance of the distribution system of the later managers. .
In the process of Machining Titanium alloy, the titanium alloy material itself has low modulus of elasticity, large elastic deformation, high cutting temperature, low thermal conductivity and high chemical activity at high temperature, which makes the sticky knife phenomenon serious, easily aggravating the tool wear and even breakage, which leads to the poor machinability of the titanium alloy. Therefore, machining titanium alloy requires proper cutting tools and good machining technology.
Machining Titanium
Machining Titanium,Titanium Machining Parts,Titanium Cnc Turning Machining Parts
Buildre Group Co., Ltd --- Hong Kong RYH CO., LTD , https://www.bldcncmachining.com